Radiative Forcing, Climate Sensitivity & Boundary Conditions of Runaway Climate Change
David Wasdell, December 2008
[Initially prepared for the Tällberg Tipping-Points Workshop 25th and 26th June 2008 The workshop was part of the Tällberg Consensus Project on “The Tipping Points we cannot cross: Defining the Boundary Conditions for Planetary Sustainability”.] Revised and expanded on 10th December 2008
Executive Summary
From a systems dynamics perspective, radiative forcing (the gap between energy received from the sun and that re-radiated back into space) can be considered as a stock. At any given time, its value depends on a set of sources and sinks, drivers and feedbacks. All of these factors are dynamically interdependent and vary over time.
We take as base the pre-industrial (1750 CE) condition of dynamic thermal equilibrium, with near-zero radiative forcing, and given values for average global temperature, albedo and atmospheric composition.
The value of radiative forcing at any subsequent point in time depends not only on changes in the values of albedo and the concentrations of atmospheric greenhouse gases, but also on the change in average global temperature. For any given atmospheric composition, the hotter the surface of the earth, the more energy is radiated back into space. Rising temperature lowers radiative forcing.
The first working note seeks to establish a first-order approximation for the present value of the decrease in radiative forcing that is caused by the current rise of 0.8ºC in average global temperature. The derived value of ~ 1.15 w.m-2 is based on the understanding that, ignoring all but fast feedbacks, temperature reaches equilibrium conditions with an increase of ~ 2ºC at an atmospheric concentration of 440 parts per million of the carbon dioxide equivalent of all greenhouse gases apart from water vapour, (i.e. 440 ppm CO2e). Since the present situation is not under equilibrium conditions, the figure of 1.15 w.m-2 is likely to be too high and the given estimate of current radiative forcing is therefore still too conservative. Strategic interventions to stabilise climate should probably be even more stringent than those developed in the text.
Building on this foundation, the second working note focuses on the residual radiative forcing still active if global temperature rises by 2ºC with a stable atmospheric concentration of 440 ppm of CO2e. A value of 6.4 w.m-2 is derived. The figure is more than double the present value, rather than diminishing to zero as in current models. The critical threshold or tipping-point of unstoppable runaway global heating would appear to have been initiated well before the 2ºC increase in average global temperature had been reached. The note concludes with an Exemplar Thought Experiment which confirms that no equilibrium condition of global temperature can be achieved from enactment of the current strategic attempt to stabilise concentrations of atmospheric greenhouse gases at 440 ppm CO2e. Accelerating and uncontained runaway climate change would have been precipitated.
The third working note addresses the issue of “runaway” climate change, exploring the precipitating conditions, ultimate limiting factors and climatic consequences of the behaviour. The conclusion is reached that the threshold for the onset of runaway climate change has already been passed.
The fourth working note, together with Appendices 1 & 2, explore a variety of approaches to the calculation of climate sensitivity. Implications of the analysis require an urgent review of the sensitivity levels in the current ensemble of computer models. We also face an urgent and radical re-evaluation of the current strategic response to global warming.
Appendices 3 & 4 summarise the dynamics of water-vapour feedback and the endothermic phase-change of ice-melt as contributions to the feedback system of global climate change.
Climate re-stabilisation (reduction of radiative forcing to zero) can still theoretically be achieved by preventing all further additions to the stock of anthropogenic greenhouse gases, coupled with the aggressive draw-down of carbon dioxide already in the atmosphere. The window of opportunity afforded by the time-lag between radiative forcing and increasing temperature is, however, extremely limited. It is narrowed even further by the temperature-sensitive feedback-driven acceleration in the value of radiative forcing.
The series of working notes is preceded by a section providing some introductory background material, while the concluding set of references includes active links to some of the most recent field-leading documents.
* * * * * * * * *
Background
Radiative forcing (the gap between energy received from the sun and that re-radiated back into space) is governed by changes in albedo, changes in the concentration of greenhouse gases in the atmospheric mantle, and changes in the average global temperature itself. When change is very slow, the system stays very close to thermal equilibrium, radiative forcing remains close to zero and slow change in temperature is the critical parameter. In the current situation, those conditions no longer apply.
Radiative forcing has been driven away from equilibrium on an accelerating trajectory by the rapidly rising concentration of atmospheric carbon dioxide together with other anthropogenic greenhouse gases. The effect is reinforced by changes in albedo, coupled with the dynamic second-order feedback system. As radiative forcing increases, the time-lag before eventual achievement of equilibrium temperature also expands. It is governed by the thermal inertia of the earth system and further damped by the endothermic phase changes from ice to water and from water to water-vapour.
Under these conditions of non-equilibrium climate change, radiative forcing is itself the fundamental parameter. Radiative forcing (or “global heating”) is the heat engine driving climate change. As it increases, the rate of climate change increases. Global heating changes in real time, global warming follows slowly with a long time-delay. Current observed increase in the rate of change in monitored parameters of climate change is solid evidence of increase in the absolute value of radiative forcing. Rather than being the causal driver of the system behaviour, change in the rate of global warming is therefore one among many symptomatic consequences of increased radiative forcing.
As was pointed out in “The Feedback Crisis in Climate Change” (August 2005, Section 8.8), the survival of civilisation as we know it:
“requires the re-stabilising of geo-solar thermal equilibrium at a temperature close to the maximum of the warm inter-glacial periods. As an intervention, that entails the slowing, halting and reversing of the increase in global heating, followed by a sustained period of global cooling with negative radiative forcing. Eventually the global heating would need to stabilise at zero with the temperature held constant at the new and acceptable thermal equilibrium. (See Figure 1 below)
“The effective achievement of such a strategic intervention would only be possible if and while the capacity to reduce GHG concentration outweighed the combined (and time-delayed) power of the set of positive feedback mechanisms. If those criteria were not met, we would face uncontrollable, runaway climate change for the foreseeable future with catastrophic consequences.”
This is the global tipping point that must not be crossed. It defines the fundamental boundary condition for planetary sustainability.
Figure 1
The task of climate stabilisation (stopping of feedback-driven runaway climate change and its consequent major extinction event) depends on reducing radiative forcing to zero.
In addition, the avoidance of dangerous or catastrophic impacts of climate change (including the crossing of irreversible tipping points in the sub-global system behaviour) requires the management of the equilibrium temperature at which the climate stabilises.
Working Note 1: Reduction in Radiative Forcing due to
Temperature rise of 0.8ºC.
This is an attempt to arrive at a first order approximation of the value assuming linear relationships between ppm and forcing within the range under consideration.
[There is an embedded dependency on the Charney value of climate sensitivity of 3ºC for a doubling of concentration of atmospheric CO2. However there is now serious questioning of the Charney figure, and values of up to five times this sensitivity are currently being suggested. See Note 4 on sensitivity below.]
If (1): An additional 85 ppm CO2 ~ 1.5 w.m-2 (CO2 forcing at year 2000 compared to pre-industrial level of 280 ppm.)
And (2): 440 ppm CO2 ~ 2ºC at equilibrium using Charney sensitivity which includes fast feedbacks. (Note that 440 ppm represents an increase of 160 ppm on the pre-industrial level of 280 ppm.)
Then (3): Equilibrium rise of 0.8ºC ~ 160 x 0.8 x ½ = 64 ppm CO2
From (1): 1 ppm CO2 ~ 0.018 w.m-2
Hence rise of 0.8ºC ~ 64 ppm CO2 ~ 1.15 w.m-2 Say Approx. 1.2 w.m-2
Current radiative forcing from all sources, (based on Hansen (2005) as modified by Wasdell in the Westminster Briefing and updated with most recent satellite data on H2O feedback) is ~ 4 w.m-2 less reduction due to rise in average global temperature of 0.8ºC,
i.e. Approx. = 3 w.m-2
Note: Prevention of further heating (i.e. no more than 0.8ºC above pre-industrial average) could hypothetically be achieved by instantaneous reduction of this 3 w.m-2 to zero.
Now from (1): 1 w.m-2 ~ 57 ppm CO2
So reduction by 3 w.m-2 would require reduction of 171 ppm CO2e from current level of 450 ppm CO2e or (leaving non-CO2 forcing alone) from current concentration of 387 ppm CO2.
Prevention of further heating therefore requires a target concentration
of 279 ppm CO2e (or 214 ppm CO2).
If we follow the argument of Code Red that we need to reduce temperature rise to 0.5ºC above pre-industrial value to retain polar ice, suppress ice-albedo feedback and limit dangerous rise in sea-level, then we would require an additional reduction of 24 ppm CO2e.
This would give target concentration of 255 ppm CO2e or 190 ppm CO2.
In practice, during the time-lag of the intervention, both radiative forcing and temperature would have increased above present figures, necessitating even further cuts. The intervention would also remove industrial particulates from the atmosphere. This would end global dimming and increase radiative forcing by an extra 1 w.m-2 (could be significantly higher, i.e. up to 1.4 w.m-2 ), necessitating even more stringent reduction in target concentrations by a further 57 to 80 ppm CO2.
Working Note 2: Residual Radiative Forcing at 2ºC above
Pre-industrial Average Global Temperature, with Concentration of CO2e held stable at 440 ppm.
It is the standard understanding that a stable atmospheric concentration of 440 ppm CO2e would lead to a stable climate (i.e. zero radiative forcing) with an equilibrium temperature of about 2ºC above pre-industrial global average.
Let To be the time at which this rise of 2ºC is achieved.
Then Radiative Forcing at To (RFTo) is made up of:
- Forcing from 160 ppm CO2e @ 0.018 w.m-2 per 1 ppm ~ 2.9 w.m-2
- Feedback forcing from H2O vapour @ 2 w.m-2 per 1ºC ~ 4.0 w.m-2
- End of global dimming from airborne particulates ~ 1.4 w.m-2
- Albedo change from loss of snow/ice extent and duration ~ 1.0 w.m-2
- RF reduction due to 2ºC rise in Average Global Temperature ~-2.9 w.m-2
Hence residual Radiative Forcing at To i.e. RFTo ~ 6.4 w.m-2
Instead of being reduced to zero as previously assumed, the outcome is global heating running at some 3.4 w.m-2 more than the net current radiative forcing, (i.e. more than double the present value). Rather than stabilising the climate at 2ºC above pre-industrial level, the result is a major acceleration of global heating.
Climate stabilisation at 2ºC above pre-industrial level would necessitate a reduction of 6.4 w.m-2 in order to reduce radiative forcing to zero. Using the previous figure of 1 w.m-2 ~ 57 ppm of CO2e, then we would have to reduce the atmospheric concentration by some 365 ppm from the initial value of 440 ppm, i.e. to a new target of 75 ppm CO2e.
Holding non CO2 greenhouse gases stable and applying the reduction to CO2 alone, we would have to drive down the atmospheric concentration of CO2 from about 387 ppm to 22 ppm. That is out of the question. Aggressive carbon-dioxide removal would have to be reinforced by massive geo-engineering with questionable outcomes. The implication is that the critical threshold or tipping-point of unstoppable runaway global heating would have been initiated well before the 2ºC increase in average global temperature had been reached.
Some further factors need to be taken into consideration:
- Global sinks for atmospheric CO2 would be degrading during and beyond the time taken to reach the 2ºC mark.
- Massive amounts of non-anthropogenic CO2 would be released into the atmosphere from: climate-driven die-back of forests; bacterial activity in carbon-rich soils; drying peat-bogs; nitrogen-oxide catalysis of enzymatic release of CO2 from the same source.
- Non-anthropogenic methane would be being released from thawing Tundra permafrost and from sea-bed clathrate stores (a process already initiated with the current increase of 0.8ºC and a current radiative forcing of 3 w.m-2).
- Further acceleration in the decrease of ice and snow related albedo would occur during the intervention time.
Maintaining the concentration level of greenhouse gases at 440 ppm CO2e would therefore necessitate continued and increasingly drastic reduction in anthropogenic emissions, quickly moving to an increasingly intense carbon-removal regime even before any intervention to reduce radiative forcing is taken into account. Climate re-stabilisation (stopping of runaway behaviour) under these conditions would be quite impossible.
An Exemplar “Thought Experiment”
(I am deeply grateful to Peter Wadhams for suggestions that led to the inclusion of this section.)
It is now possible to attempt to deduce a conservative minimum figure for the change (from the pre-industrial base-line) in average global temperature at eventual equilibrium (i.e. zero radiative forcing) resulting from a sustained concentration of greenhouse gases at 440 ppm CO2e.
Let this figure be represented by ∂Te.
From above we recognise that there is a residual radiative forcing of 6.4 w.m-2 with an increase of global average temperature of 2ºC and a concentration of greenhouse gases at 440 ppm CO2e. Then:
a. Forcing from 160 ppm CO2e @ 0.018 w.m-2 per 1 ppm ~ 2.9 w.m-2
b. Feedback forcing from H2O vapour @ 2 w.m-2 per 1ºC ~ 2∂ w.m-2
c. Assume no further change due to end of global dimming ~ 1.4 w.m-2
d. Conservatively hold forcing from change in snow/ice albedo ~ 1.0 w.m-2
e. RF reduction due to ∂ºC rise in average global temperature ~ -1.45∂ w.m-2
Giving rise to the simple equation:
2.9 + 2∂ + 1.4 + 1 -1.45∂ = 0
i.e: 0.55∂ = -5.3 ºC
This yields no real value for ∂Te
Under these conditions, no future equilibrium is attained and the condition of uncontained accelerating runaway global heating ensues.
It should be noted that at the time of writing the atmospheric concentration of greenhouse gases has already passed the figure of 440 ppm CO2e, and is rising on a hyper-exponential trajectory.
Working Note 3: “Runaway” Climate Change
In system dynamics, the term “runaway” refers to a stage of system behaviour in which positive (amplifying) feedbacks exert a greater power than the negative (damping) feedbacks. This Working Note enables us to derive a first-order approximation of the threshold at which runaway climate change is precipitated.
The threshold at which the global climate system moves into runaway heating marks the boundary beyond which, for an increase in temperature (ΔT), the increase in radiative forcing driven by positive feedback (ΔRF+f) is greater than the decrease in radiative forcing driven by negative feedback (ΔRF-f)
i.e. For temperature increase ΔT
ΔRF+f > ΔRF-f
We can also express this as:
∂ (ΔRF+f )
∂T (ΔRF-f )
Or as:
∂2 (ΔRF+f )
∂T2 (ΔRF-f )
Diagrammatically (see Figure 2) we can illustrate the three zones. In the contained, near equilibrium, field of the glacial/interglacial period, positive feedback is weaker than negative feedback for small changes in temperature. At the watershed of unstable equilibrium the values are equal. Beyond that point positive feedback is stronger than negative feedback for small changes in temperature, resulting in sustained runaway global heating.
Figure 2
In this third zone, radiative forcing increases with rising temperature, and does not tend to an equilibrium value.
In passing we note that the current value of radiative forcing is 3 wm-2 and the rate of temperature increase is observed at 0.30 ºC per decade. We can therefore deduce that the inertial sensitivity of the whole earth system is:
0.010 ºC per annum per 1 wm-2
Negative feedback between temperature and radiative forcing is occasioned by increase in the radiative output from the earth with rise in surface temperature. It is currently calculated at
~ 1.45 wm-2 ºC-1
With concentrations of anthropogenic greenhouse gasses held constant, the value of temperature-driven positive feedback on radiative forcing is already running at:
> 2.0 wm-2 ºC-1
(This figure represents the current best valuation of the strong fast feedback of water-vapour. It is significantly enhanced by decrease in ice albedo, and climate-driven increase in non-anthropogenic emission of carbon-dioxide and methane.)
We therefore deduce that the climate is already in a condition of runaway heating.
Climate re-stabilisation demands a sharp anthropogenic reduction in radiative forcing that outpaces the current imbalance. It will have to take effect in the time-window occasioned before the (non-anthropogenic) temperature-driven increase in the value of positive feedback exceeds the potential maximum value of the anthropogenic intervention.
As the value of radiative forcing is reduced to zero, the temperature ceases to rise, and the temperature-driven positive feedbacks would cease to operate. Climate would re-stabilise, albeit at a temperature which might still push the earth system beyond the threshold of acceptable climate change. It might also exceed the trigger thresholds of certain sub-system tipping points, the impact of which would be catastrophic. A further period of global cooling would be imperative to reduce these risks to an acceptable level.
Conditions for Containment of Runaway Climate Change
In earth system dynamics, the runaway period is itself subject to boundary limitations:
- The decrease in albedo caused by progressive melting of ice and snow declines with rising temperature. (The extent of glaciation is limited, and when all snow and ice has gone, the positive feedback of the ice-melt change in albedo is reduced to zero.)
- There is only a limited stock of carbon held in the biosphere that can be released via oxidation into the atmosphere. When all such sources are exhausted, the climate-driven increase in atmospheric concentrations of CO2 comes to an end, so terminating this factor of the carbon-cycle feedback.
- Similarly there is a limit to the amount of methane available to be released from store whether in peat bogs, in Tundra permafrost, or in the sea-bed clathrate deposits. As that limit is reached, the methane feedback terminates. Methane is comparatively short lived in the atmosphere, and the methane feedback would begin to attenuate when the atmospheric concentration reached the point at which the release rate began to be balanced by the decay rate. Methane decay increases the stock of atmospheric CO2, reducing the greenhouse effect of the gas by a factor of about 23. As the methane stock diminished, so the increase in the CO2 stock would slow. In the long-term, the overall process therefore contains the methane feedback effect.
- As stocks of atmospheric greenhouse gases stabilised, the degrade in the sink capacity of the global commons would also eventually begin to slow down.
- The higher global temperature would increase the stock of water-vapour in the atmosphere, leading eventually to significant increase in global cloud cover with enhanced reflection of solar energy from the upper cloud surface. (Increased cloud albedo) This would eventually constitute a negative feedback capable of damping the system behaviour.
The outcome would be a limitation of the period of runaway climate change, and the emergence of a new condition of dynamic thermal equilibrium. This “hot-earth scenario” would then be subject to slow cooling over a range of millennia as atmospheric CO2 was gradually sequestered in the geological processes. The peak temperature would be of the order of 10s of degrees above the present, and conditions would cause the extinction of most current life-forms.
Working Note 4: Approaches to Climate Sensitivity
- The classical (Charney) definition of climate sensitivity is the equilibrium temperature increase generated by a doubling of the concentration of atmospheric carbon dioxide from the base line of the pre-industrial state. It includes “fast feedbacks” like temperature-related increase in the concentration of atmospheric water-vapour and albedo changes due to land use. The mathematically derived figure of 3ºC is taken as a general rule in climate-change predictions.
- Using the paleo-climate records, James Hansen et al. have recently attempted to detect the additional forcing, and hence temperature increase, occasioned by the inclusion of some of the “slow feedbacks” like vegetation change, and the effects of slow change in the extent of the ice and snow cover with consequent changes in albedo. This approach adds a further 3ºC to the sensitivity, increasing it to 6ºC for a doubling of atmospheric concentration of CO2.
- At the current range, climate sensitivity should provide the same value for halving the concentration of atmospheric CO2 as it does for doubling it. If we take the pre-industrial level of 280 ppm CO2 and halve it then we have a concentration of 140 ppm, a level which has never been observed in the paleo records. We do know however (for instance from the glacial/interglacial records of the Vostok ice cores) that a reduction of 100 ppm is equivalent to an equilibrium change of 5ºC in average global temperature. Treating the relationship as linear, this gives a climate sensitivity of 7ºC for the halving of concentration of atmospheric CO2. However, the relationship is not linear, but logarithmic. The lowest 40 ppm has an increasingly sharper gradient than the upper 100 ppm. The minimum sensitivity should therefore be placed in the range of 7.5 to 8.0 ºC. This figure should be continuous with the doubling sensitivity applied in calculations of expected climate change, yielding an increase in temperature at least 2½ times that predicted in current models.
- A more accurate indication of climate sensitivity under these conditions may be provided by regression analysis of the correlation between temperature and the atmospheric concentration of CO2 in the Vostok records. (See Appendices 1, 2, and 3 below). A fairly simple regression analysis of the maxima and minima in the glacial/interglacial records affords a correlation of 20 ppm of C02 per 1ºC rise in temperature. That would yield a climate sensitivity for doubling of CO2 of 4.7 times the Charney value, i.e. a rise of 14ºC above the pre-industrial value. Engelbeen’s more sophisticated analysis yields a correlation of 17.6 ppm CO2 per 1ºC rise in temperature. His work indicates a value 5.3 times the Charney figure and raises the spectre of an increase in the global average temperature of some 16ºC for a doubling of pre-industrial concentration of atmospheric CO2. That should be doubled to give an increase of some 32ºC at polar latitudes.
- All of the above figures are based on slow, near-equilibrium, climate change, a situation which is no longer applicable. They do not take account of the dynamic feedback processes brought into play in current conditions of far-from-equilibrium behaviour. Anthropogenic release of greenhouse gases has triggered radiative forcing at a rate that is accelerating much faster than the inertial response of the earth system. This has a different effect on the feedback dynamics. Responses in the glacial/interglacial record reflect slow, close to equilibrium, bio-physical adjustments to gradual (Milankovitch) variations in insolation of the northern hemisphere. Today we have the possibility of climate change initiating mass release of CO2 from forest die-back and burn, as well as the methane cascade feedback. In addition, the phenomenon of second-order feedback comes into play, where the effect of any single feedback mechanism compounds the activity of all other climate-sensitive feedbacks, so accelerating the amplification of the original signal. The only exemplar material comes from study of the five great extinction events in the geological history of the earth. The Anthropocene intervention, however, appears to be running some 100 times faster than any previous example (except that of massive asteroidal impact). We are in unknown territory.
Appendix 1: Climate Sensitivity: A Whole-Earth
System Dynamic Approach
Introduction
Computer simulations of the whole-earth system dynamics are constantly improving their capacity to model the complex feedback mechanisms involved. Nevertheless there is still significant uncertainty in the prediction of climate sensitivity which is defined as:
The increase in average global temperature at equilibrium resulting from a doubling of concentration of atmospheric carbon dioxide from its pre-industrial base. (That is from 282 parts per million to 564 ppm.)
The leading ensemble of computer models offers a range of outcomes from 1.4ºC to some 5.6ºC. Programmes take into account the molecular equations of CO2 absorption of infra-red radiation from the earth surface, together with an array of related dynamics, feedbacks and other contributing factors, integrated across a grid of earth-surface cells with interacting vertical layers. For a summary of the categories of feedbacks and the many specific mechanisms, see the treatment in “Positive Feedback and the Acceleration of Climate Change, Part 2”. It is available in presentation and pdf versions at:
www.meridian.org.uk/Resources/Global%20Dynamics/TippingPoint/index.htm
In this Appendix, however, we move away from the world of computer modelling to examine the Vostok ice-core data for information that could throw new light on the issue of climate sensitivity. The rate of change in geological time was comparatively slow, and radiative forcing remained close to zero. As a result the earth system responded to insolation changes in a state of near equilibrium. The record therefore affords an indication of correlation of CO2 concentration with equilibrium temperature.
It is important to note that in this paper, the CO2 concentration data is seen not as causal of the temperature variation, but as an indicating marker of the equilibrium temperature reached by the whole earth system. The beauty of this approach is that the sensitivity reading includes by definition the equilibrium effects of all the feedbacks and complex dynamic responses currently approximated in the computer models.
A validity-test of the accuracy of any computer model requires that its predictions must match closely with the observed behaviour of the system being simulated. The significant mismatch between prediction and observation is an indication that further major refinement of the models is now required.
If the sensitivity figures indicated in this study of the Vostok data can be trusted, we face an urgent and radical re-evaluation of the current strategic response to global warming.
* * * * * * * *
Observational Data
Figure 3
The Vostok ice core analysis now provides us with information correlating temperature with the concentration of atmospheric CO2 reaching back over 650,000 years. However, in order to achieve the most accurate figures for climate sensitivity which are relevant to our current situation, this study limits its attention to the four most recent glacial and interglacial cycles covering the last 400,000 years. These records enable us to explore climate sensitivity based on observational data and so test the predictive accuracy of the current computer models.
Temperature changes at Vostok are larger than the average temperature changes for the whole earth system. For instance the temperature difference between the coldest stage of the last ice age and the peak of the current warm inter-glacial period shows as some 11ºC at Vostok, while we understand the average global temperature shift to be about 5ºC. An adjustment ratio of 0.455 has therefore been applied to the Vostok figures in order to give the best approximation of the global average shift. The timescales involved are long and the changes in radiative forcing are therefore small. Temperatures can therefore confidently be taken as representing equilibrium outcome levels throughout the sequence.
Sensitivity Analysis
Cycle A (-100ky to present)
- CO2 concentration increased from a floor of 182 ppm to a maximum (pre-industrialisation) of 282 ppm, a rise of 100ppm.
- Vostok records show a corresponding temperature rise of 11ºC representing a change in average temperature of 5ºC.
- Sensitivity in this cycle can be expressed as:
A rise of 20.0 ppm in CO2 concentration correlates with a rise of 1ºC.
Cycle B (-200ky to –100ky)
- CO2 concentration increased from a floor of 185 ppm to a maximum of 290 ppm, a rise of 105 ppm.
- Vostok records show a corresponding temperature rise of 12ºC, representing a change in average temperature of 5.46ºC.
- Sensitivity in this cycle can be expressed as:
A rise of 19.2 ppm in CO2 concentration correlates with a rise of 1ºC.
Cycle C (-300ky to –200ky)
- CO2 concentration increased from a floor of 187 ppm to a maximum of 280 ppm, a rise of 93 ppm.
- Vostok records show a corresponding temperature rise of 11ºC, representing a change in average temperature of 5.0ºC.
- Sensitivity in this cycle can be expressed as:
A rise of 18.6 ppm in CO2 concentration correlates with a rise of 1ºC.
Cycle D (-400ky to –300ky)
- CO2 concentration increased from a floor of 183 ppm to a maximum of 300 ppm, a rise of 117 ppm.
- Vostok records show a corresponding temperature rise of 11ºC, representing a change in average temperature of 5.0ºC.
- Sensitivity in this cycle can be expressed as:
A rise of 23.4 ppm in CO2 concentration correlates with a rise of 1ºC.
If we take the average sensitivity across all four cycles we have an increase of 20.3 ppm in atmospheric concentration of CO2 correlating with a 1ºC change in average global temperature in conditions of system equilibrium.
(Detailed regression analysis of the correlation between temperature and CO2 concentration across the whole Vostok record performed by Ferdinand Engelbeen, [see Appendix 2 below] shows a sensitivity of 8 ppm per 1ºC at the Vostok site. If we apply the same adjustment ratio as that used in the paper above, this is equivalent to 17.6 ppm per 1ºC for the average global surface temperature.)
Implications of Observational Data
Doubling of concentration of atmospheric CO2 from pre-industrial levels represents a rise of some 282 ppm. Applying the average sensitivity from the observed data from Vostok would lead us to expect an equilibrium temperature increase of 13.9ºC, in marked contrast to the prediction of about 3ºC of the current computer ensemble.
If we take Engelbeen’s regression analysis across the whole Vostock time-frame then we arrive at a slightly more sensitive relationship yielding a possible equilibrium figure of 16ºC above the pre-industrial level.
There would appear to be a discrepancy between computer models and observational data of the order of a factor of 4 or 5.
Causality, outcomes and the irreversibility of the arrow of time.
It is recognised that the glacial/interglacial cycles are initiated by change in the insolation of the northern hemisphere following the Milankovitch variation in the orbital precession, and the wobble and tilt of the earth’s axis. These small shifts in radiative forcing are then amplified by the reinforcing feedback dynamics of the physical and biological elements of the system.
Historically, the increase in concentration of atmospheric CO2 is an effected outcome of precipitating shifts in temperature. It also contributes, via the feedback dynamics of the greenhouse effect, to the subsequent amplification of the temperature change.
In the current situation, the initial shift in temperature is caused by the anthropogenic release of greenhouse gas. This replaces the initiating changes previously occasioned by the Milankovitch variations, so reversing the conditions of causality. Whatever the trigger, the inherent, positive-feedback-dominated, instability in the system dynamics then responds by amplifying the signal. To start with, the anthropogenic increase in concentration of atmospheric CO2 precipitates a slow process of global heating. Then the positive feedback dynamics take over to drive the system into a condition of runaway climate change. Eventual containment in geological time is at a new thermal equilibrium at a much higher level than that predicted from the effect of the precipitating signal on its own.
Appendix 2: Engelbeen’s Regression Analysis of the CO2/Temperature ratio in the Vostok Ice-Core
The analysis of the main text has used the maximum and minimum values of the glacial/inter-glacial records from the Vostok Ice Core. It is possible to generate a set of further correlation points from the record to check the minimalist approach adopted there. It is a task which has been undertaken by Ferdinand Engelbeen, who, on the 27th November 2005, posted the following to the Real Climate discussion group:
“After carefully matching the CO2 gas age to the nearest ice age, the change of CO2 is some 8 ppmv for each change of 1 K in reconstructed temperature for the Vostok ice core over the full 420,000 years period. The Dome C record seems to confirm this correlation between CO2 and temperature.”
See: http://www.realclimate.org/index.php/archives/2005/11/650000-years-of-greenhouse-gas-concentrations/ (entry 39)
And: http://www.ferdinand-engelbeen.be/klimaat/correlation.html
Engelbeen’s regression analysis of the data is presented in visual form:
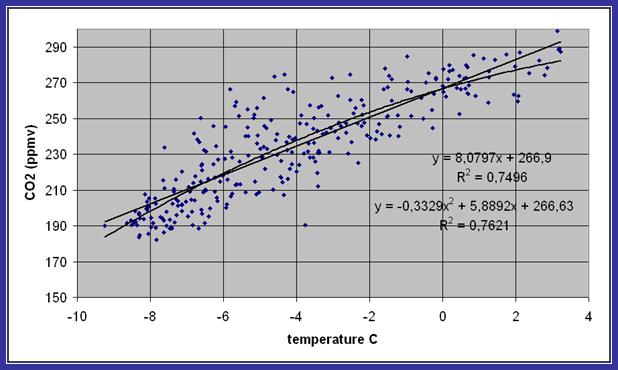
Figure 4
The sensitivity of 8 ppm per 1ºC at Vostok correlates with a sensitivity of 17.6 ppm per 1ºC for the earth system as a whole. Engelbeen’s analysis indicates that the overall sensitivity matches the lower end of the set of maximum/minimum sensitivities noted in the main paper. His values would yield a climate sensitivity at the Vostok site of 35ºC for a doubling of pre-industrial levels of atmospheric CO2 concentration. This is equivalent to a climate sensitivity of 16ºC for the average global surface temperature.
Appendix 3: The Role of Water-Vapour in the
Climate Feedback System
We know that uncondensed atmospheric water-vapour is far and away the most influential greenhouse gas. However, in macro-system terms, while average global temperature remains constant and close to equilibrium, change in the overall contribution of water-vapour can be ignored. Primary climate change is initiated by anthropogenic increase in the concentration of atmospheric CO2. The carbon cycle (including feedbacks) is independent of water-vapour concentration.
It is only as global temperature begins to rise (as a long-time-delayed response to the greenhouse effect of increased concentration of CO2), that we see the start of change in the water vapour concentration. As a temperature-dependent feedback process, water-vapour effects are therefore secondary processes in climate change.
Rising temperature at the water-air interface increases evaporation and raises water-vapour concentration. Warmer air holds more water-vapour in gaseous form before reaching dew-point and condensing to form clouds. The resultant increase in greenhouse effect further elevates temperature at the water-air interface. The process therefore constitutes a positive feedback loop in global heating.
The converse is equally true. Lower temperature at the water-air interface decreases evaporation and lowers atmospheric water-vapour concentration. Colder air holds less water-vapour in gaseous form before reaching dew-point and condensing to form clouds. The resultant decrease in greenhouse effect further lowers temperature at the water-air interface. The process therefore constitutes a positive feedback loop in global cooling.
Although omitted under pressure from Governmental agents from the final version of the Summary for Policy Makers of the IPCC FAR WG1, the polished scientific draft included the paragraph:
“Water vapour increases lead to a strong positive feedback that amplifies the global mean temperature response to increases in radiative forcing. New observational and modelling evidence confirms the importance of the expected feedbacks linked to water vapour, estimated to be approximately 1 w.m-2 per ºC of global average temperature increase, or a 40-50% amplification of global mean warming.”
The final phrase should be read in the current context of a CO2-driven radiative forcing of 2.0 w.m-2 and an average temperature increase of 0.8ºC. Most recent satellite observation of the strength of water vapour feedback is double the conservative estimate embedded in the IPCC Report, namely 2 w.m-2 per ºC of global average temperature increase. This drives an increase in forcing of 1.6 w.m-2 and represents an amplification of 80% of current CO2 forcing. However, if average global temperature increased by 3ºC, the contribution to radiative forcing from the effects of increased concentration of water vapour would reach 6 w.m-2. This would overwhelm all other components of the radiative forcing and reinforce conditions of runaway climate change. It would also render impotent any anthropogenic reduction in CO2 concentrations designed to prevent further global warming.
The processes are somewhat modified by the endothermic nature of the liquid-gas phase change (and conversely by the exothermic nature of the gas-liquid phase change). Energy absorbed in the phase change cools the water-air interface and damps the change in evaporation. Increased concentration in water-vapour therefore reduces the expected temperature rise of global warming (though not the overall increase in global energy due to change in radiative forcing!). Energy is stored in the atmosphere as latent heat, to be released later in time and elsewhere in location at the point of condensation and cloud formation. This is the process that drives increase in storm energy, and distributes heat from the hotter tropical areas towards the cooler polar regions.
For a given change in water-vapour concentration there is a one-off investment in latent heat of evaporation. Over time, this has to be set against the cumulative increase in energy flow due to the change in greenhouse effect driven by the increase in water-vapour concentration.
* * * * * * * * *
In the geological time-scale, changes in average global temperature were initiated by small changes in hemispherical distribution of received solar energy (caused by periodic shifts in procession of planetary orbit and variation in tilt and wobble of the earth axis). Positive feedback dynamics of the water-vapour cycle amplify the effects of small changes in received solar energy with consequent effects on the biological systems and their outputs of CO2 and methane evident from the ocean sediment and ice-core records. In this way, the whole-earth climate system is held in a sensitive condition of unstable equilibrium in which small changes in received solar energy result in larger changes in global climate. Changes in water-vapour concentration do not, of course, show up in the sediment and ice-core records. Attention has therefore been focussed on the more easily observed shifts in CO2 and methane concentrations which follow the temperature change. Carbon cycle feedbacks also amplify the climate change, but do not account for the observed extent of the deviation.
In the contemporary dynamics of the Holocene period, changes in hemispherical insolation are negligible (and are expected to remain so for the next 30-50k years). Primary change in average global temperature is now driven by anthropogenic increase in concentrations of atmospheric CO2. As global warming begins to take effect, rising temperature triggers the positive feedback of the water-vapour cycle, so amplifying and accelerating the climate change and contributing to the mutually reinforcing effects of other elements in the temperature-driven positive feedback system (such as lowering albedo as ice-fields melt, the discharge of methane from thawing areas of permafrost, and cascade release of methane clathrates from shallow seas). Water-vapour feedback continues to remain operative while temperature goes on rising, even when CO2 concentrations have been stabilised or reduced. It is possible that the water-vapour feedback cycle would be more powerful than the achievable damping effects of managed reduction in concentration of atmospheric CO2. In this case the water-vapour feedback cycle would drive an accelerating and essentially uncontainable process of runaway climate change, eventually moderated only by denser and more general cloud-cover, increased cloud albedo and resultant reduction of air and surface temperatures.
Elements of Secondary Feedback. There are other factors which further enhance the role of water vapour positive feedback. One is that as polar ice retreats, the total area of open water (ocean surface area) increases. Total evaporation therefore increases on top of the increase due to the rise in average sea surface temperatures. When all the sea ice has gone, the total area of ocean surface would be increased by about 12%. (I am indebted to the contribution of Prof. Peter Wadhams for highlighting this particular point)
Another instance of secondary feedback stems from temperature-driven rise in sea level. As low-lying coastal areas become flooded the total area of ocean surface is again increased with effects on the water-vapour cycle as above. Main factors driving this are the thermal expansion as rising temperatures of ocean surface water lead to mixing and heat distribution to lower layers, and secondly to the temperature-driven melt of land-based glaciation and ice-cap formations.
Appendix 3: Phase-Change Damping of Arctic Climate
The Basic Mechanism
- Phase-change in the formation and melt of arctic ice provides a cyclic damper on the temperature profile of the Polar region.
- In summer, the endothermic phase-change from solid to liquid absorbs a vast amount of energy which would otherwise contribute to the heating of the ocean, atmosphere and adjacent land areas. The summer temperature is effectively damped.
- In winter, the exothermic phase-change from liquid to solid releases a vast amount of energy which prevents the arctic temperature from dropping. The winter cooling of ocean, atmosphere and adjacent land areas is effectively damped.
- In the absence of climate change, the cycle is balanced. Summer thaw and winter freeze absorb and release equivalent amounts of energy, providing thermodynamic damping of the seasonal change in temperature. (See figure 5)
- In effect, the thermodynamics of the ice-cycle act as a giant seasonal storage heater. Solar energy is absorbed in summer and released in winter. Summer temperatures do not rise as high as they would in the absence of the phenomenon. Winter temperatures do not fall as low as they would in the absence of the phenomenon.
- The damped seasonal temperature profile can be compared with the un-damped variation in temperature in the continental Arctic land mass away from the coastal zone.
Figure 5
Effects of Phase-Change Damping on Climate Change
- As radiative forcing increases, driving the climate away from equilibrium, the volume of summer thaw starts to exceed the volume of winter freeze.
- Conditions of seasonal thermal damping persist provided a substantial store of permanent sea-ice remains at the end of the summer.
- The net endothermic phase-change absorbs heat energy that would otherwise contribute to global warming. This mechanism therefore acts as a damper on the multi-annual temperature profile of the region.
- The annual imbalance of the thaw/freeze cycle drives cumulative decrease in the average area of sea-ice cover.
Boundary Conditions of Phase-Change Damping
- As global warming proceeds, the volume of sea-ice available for summer melt decreases.
- There is a critical threshold at which the endothermic damping of the summer thaw starts to be inhibited by the shrinking volume of available ice. Beyond this point, more energy is released to heat the ocean, atmosphere and adjacent land mass. We enter a period of diminishing damping of late summer temperature.
- Increased ocean temperature (also accelerated by ice-albedo feedback) inhibits exothermic formation of winter ice. This diminishes the volume of ice available for the next summer thaw and so accelerates the onset of ice-free conditions.
- As the boundary condition of late-summer ice-free Arctic ocean is approached, the endothermic damping reduces to zero. All the available heat energy drives increasing temperature of open ocean, atmosphere and adjacent land mass. (See figure 6)
Figure 6
- Consequential annual reduction of volume of winter ice expands the period for which ice-free conditions persist in the late Arctic summer.
- During this period the exothermic damping of winter ice formation is also diminished, since progressively smaller amounts of ice are formed.
Consequential Implications
- Diminution of endothermic damping is a positive feedback in the ice cycle. It also combines with the ice-albedo feedback to accelerate the diminution of endothermic damping and speed-up the process of global heating. (Increased radiative forcing in the global system)
- Diminishing endothermic damping leads to increased temperature of ocean, air and land in the Arctic region. This has a series of knock-on effects:
- Rapidation of thaw of Tundra permafrost with consequent acceleration in release of carbon dioxide and methane from land-based stores. This secondary feedback enhances radiative forcing from the greenhouse effect of increased atmospheric concentration of greenhouse gases.
- Diminished areas and duration of land-based snow-fields decrease snow albedo and so increase radiative forcing.
- Increased temperature of the shallow Arctic seas covering the northern continental shelf, leads to acceleration of the release of methane from the clathrate stores on the sea-bed. Increased methane concentration in the atmosphere accelerates increase in radiative forcing.
- Warmer ice-free ocean and increased air temperature accelerate loss of ice-mass from the Greenland ice-cap. This adds to the desalination of the North Atlantic, with consequent slowing of the Thermohaline Current. It also accelerates the rise in sea-level.
- Increased evaporation from warmer open water increases the concentration of atmospheric water-vapour, so accelerating radiative forcing. It also leads to more cloud formation, higher energy levels in storm activity, increased precipitation, increased cloud albedo and increased cloud-based inhibition of infra-red radiation.
David Wasdell
Apollo-Gaia Project
December 2008
The Apollo-Gaia Project is hosted by
The Unit for Research into Changing Institutions (Charity Reg. 284542)
Meridian House
115 Poplar High Street
London E14 0AE
Tel: +44 (0) 20 7 987 3600
Fax: +44 (0) 20 7 515 8627
e-mail: info@meridian.org.uk
Web-sites: www.meridian.org.uk and www.apollo-gaia.org
References
The set of working notes takes as read the following papers and presentations from which wide-ranging references open access to further field research.
Hansen.J et al, Target Atmospheric CO2: Where Should Humanity Aim?
See: http://www.columbia.edu/~jeh1/2008/TargetCO2_20080317.pdf
Schellnhuber, H.J., et al: Tipping Elements in the Earth’s Climate System
See: http://www.pnas.org/cgi/reprint/0705414105v1
and: http://www.pnas.org/cgi/data/0705414105/DC1/1
and: http://www.nature.com/climate/2007/0712/full/climate.2007.65.html
Spratt D, and Sutton P, Climate Code Red
See: http://www.carbonequity.info/climatecodered/index.html.
Wasdell, D, Westminster Briefing: Feedback Dynamics and the Acceleration of Climate Change
See: http://www.apollo-gaia.org/Presentation1.pdf
And: http://www.apollo-gaia.org/Presentation5.pdf
* * * * * * * * *
Appendices 1-4 first issued August 2006
Revised February 2007
Further revision April and May 2008
Full revision of paper and appendices December 2008
|